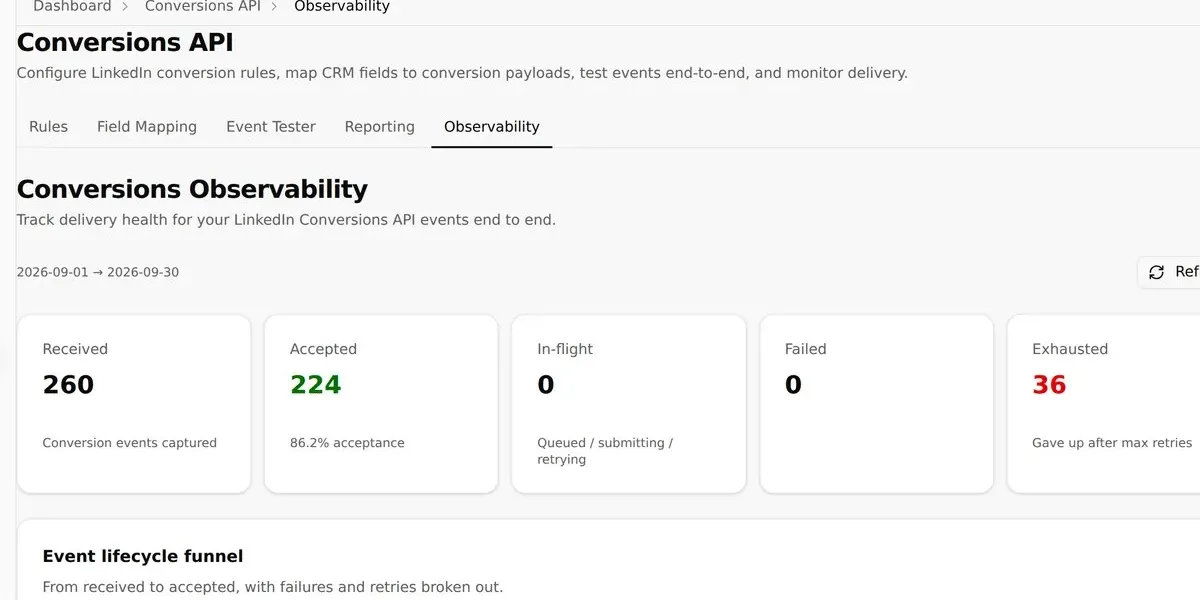
Monitor CAPI Delivery and Failures
Read the event lifecycle funnel, retries, queue health, and recent delivery errors.
Monitor CAPI Delivery and Failures is part of the authenticated Revenue Proven workspace. This guide covers Monitor CAPI Delivery and Failures on /dashboard/conversions/observability. The page is documented against the current production interface rather than a mockup or an obsolete navigation path.
What this guide covers
Observability combines the tenant’s persisted CAPI event lifecycle with recent error details and aggregate production queue health. The controls and values shown depend on the signed-in workspace, its connected providers, plan entitlements, member role, and any data already synchronized or seeded for demonstration.
Use this article to understand the page’s purpose, where its data comes from, and the safest next action. Revenue Proven separates read-only analysis from explicit mutations so that opening a page never implies that an external write has occurred.
Data, access, and permissions
Shawn’s event rows are seeded terminal demo history. BullMQ queue counts are live global operations telemetry and not scoped to Shawn. Real synchronized values can change after a scheduled sync, while seeded demo rows are deterministic examples and must not be presented as customer benchmarks.
Feature availability is enforced on the server. A button may be hidden or disabled when the workspace lacks the required plan, add-on, OAuth scope, account role, owner permission, or rollout flag. Team membership never bypasses owner-only write guards.
Operational guidance
Before changing anything, verify the active workspace, selected account, date range, provider filters, and saved configuration. If a screen looks incomplete, allow asynchronous charts and grids to finish loading and check Workspace > Connections for sync health.
Use read-only preview, filter, export, and drill-down controls freely. Treat controls labelled Save, Submit, Apply, Resume, Sync, Send, Publish, Delete, Reconnect, or Regenerate as state-changing actions and confirm their effect before continuing.
Current product workflow
Observability combines the tenant’s persisted CAPI event lifecycle with recent error details and aggregate production queue health. This screenshot was captured from the current production route while signed in to the populated Shawn Brown demo workspace.
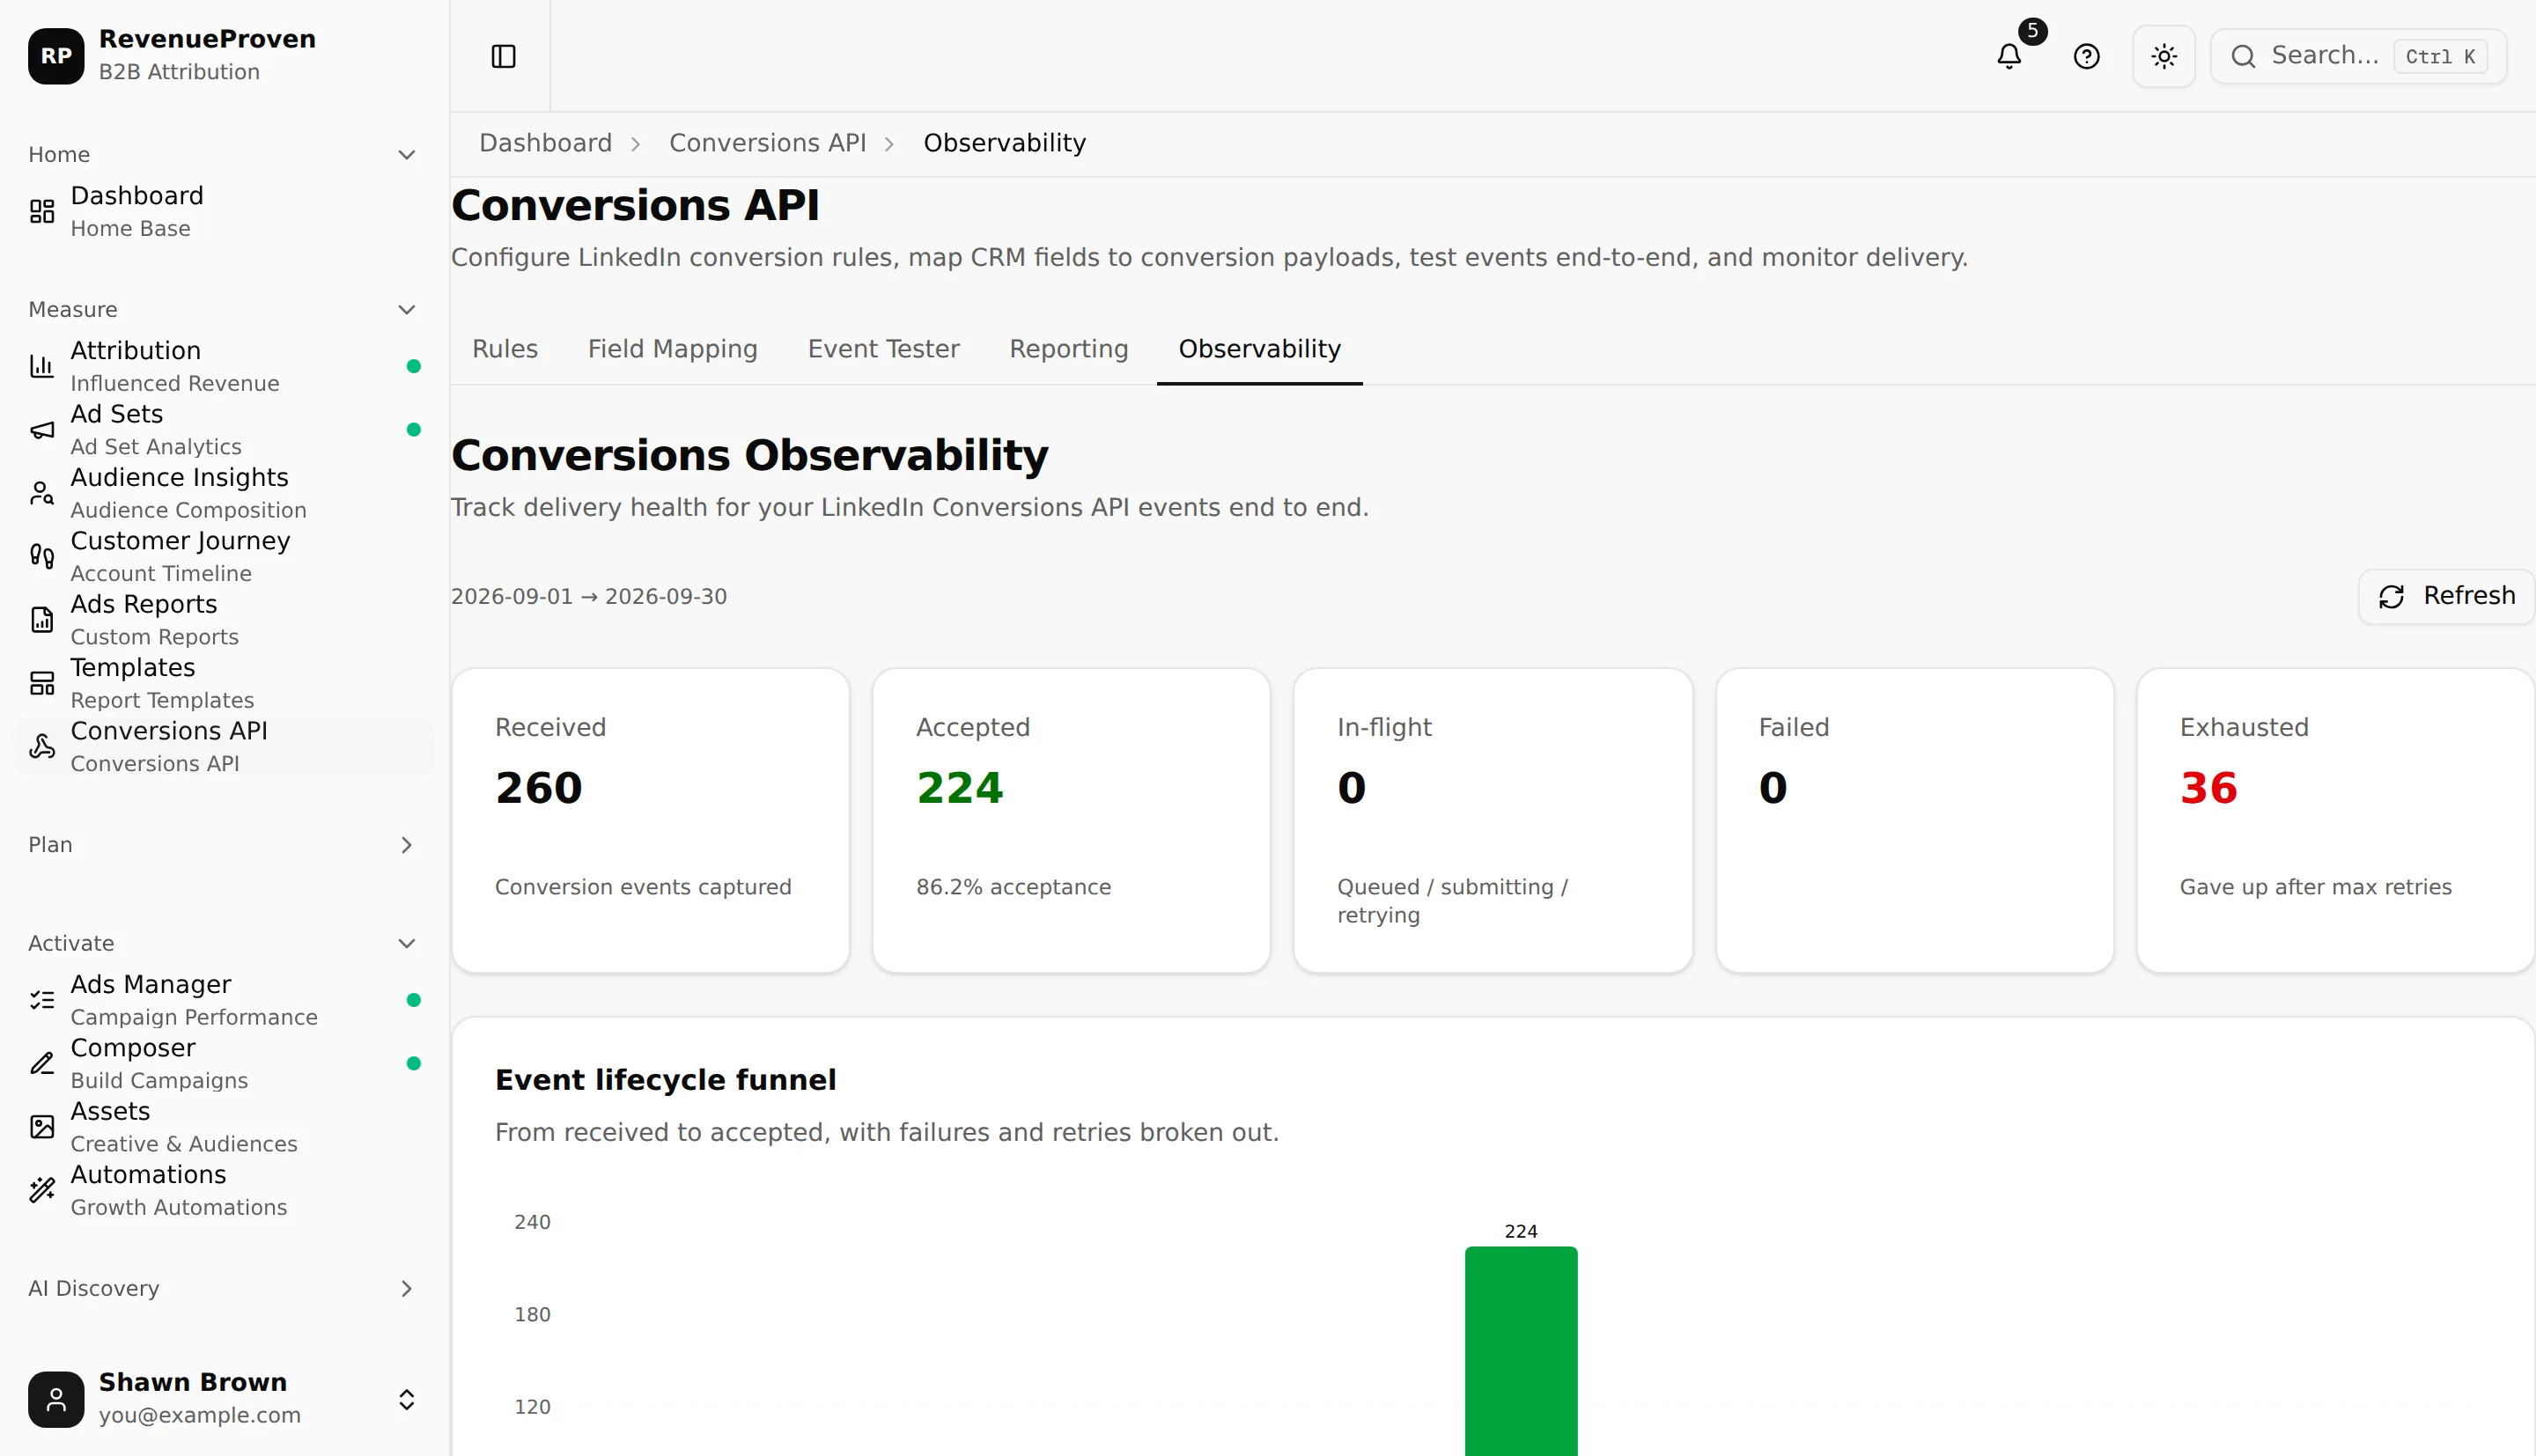
Check acceptance and exhausted counts, compare funnel stages, and use recent failures to diagnose identifier, rule, value or throttle problems. Interface labels and availability follow the current plan, role, connection, and workspace context.
Shawn’s event rows are seeded terminal demo history. BullMQ queue counts are live global operations telemetry and not scoped to Shawn. Confirm the active workspace and understand whether a control reads data, changes local configuration, or calls an external system before using it.